Understanding FMCG Volume Growth
Rising Purchase Volume Driven by Larger Baskets, Expanding SKUs, and Evolving Shopper Behaviour
The increase in volume presents a promising opportunity, but it is essential to understand what is driving this growth. Higher volume can stem from multiple factors—shoppers may be buying more items, exploring new product categories, or increasing their repertoire of Stock Keeping Units (SKUs). In some cases, it could be a combination of these behaviours.
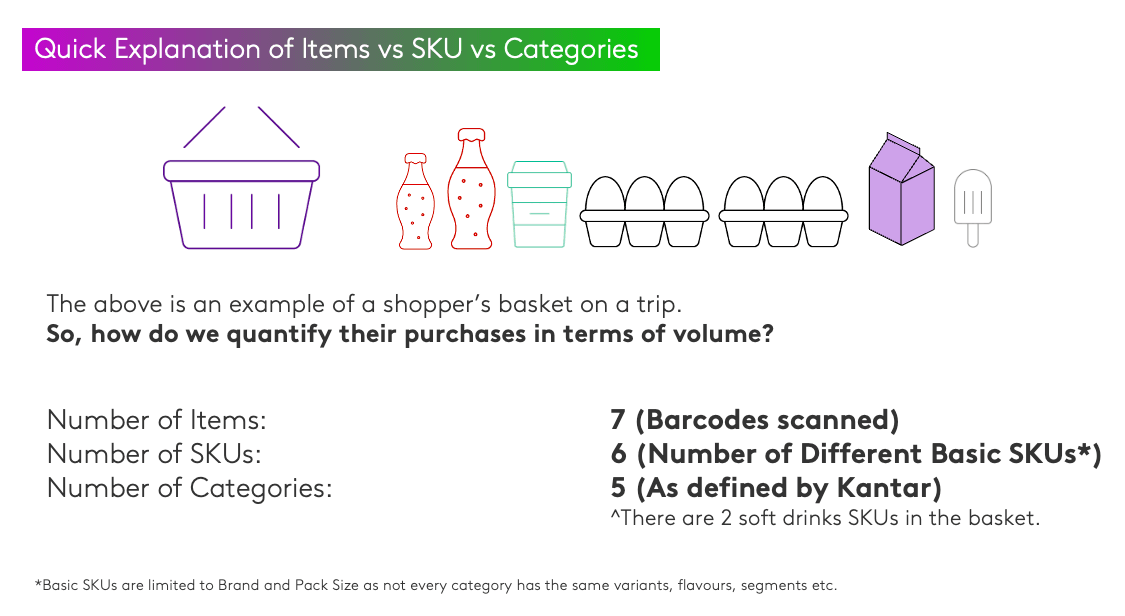
To assess volume growth in an FMCG context, it is necessary to consider different metrics since various categories operate with distinct units of measurement, such as kilograms, pieces, or packs. The number of items purchased in a trip is determined by the number of packs bought, which corresponds to the barcodes scanned at checkout. SKUs are measured based on the variety of products in the basket—if a shopper buys five units of the same SKU, it still counts as one SKU but five items. To ensure consistency in this study, SKU tracking has been limited to basic SKUs, defined by brand and pack size, as not all categories offer extensive variations such as flavours or formulations. Lastly, product categories are determined based on Worldpanel’s classification, grouping together similar items under the same category umbrella.
FMCG categories use distinct metrics (e.g., kilograms, pieces, packs), volume is measured as follows:
Items: The number of packs purchased per trip (equivalent to the number of barcodes scanned).
SKUs: The number of different packs purchased per trip. For example, buying five units of the same SKU still counts as one SKU, but five items. For this study, Basic SKUs (Brand and Pack Size) were analysed, as not all categories have variations such as flavours or segments.
Categories: Defined by Kantar as items/SKUs falling under the same category umbrella. For instance, purchasing two different brands or pack sizes of the same product type would count as one category.
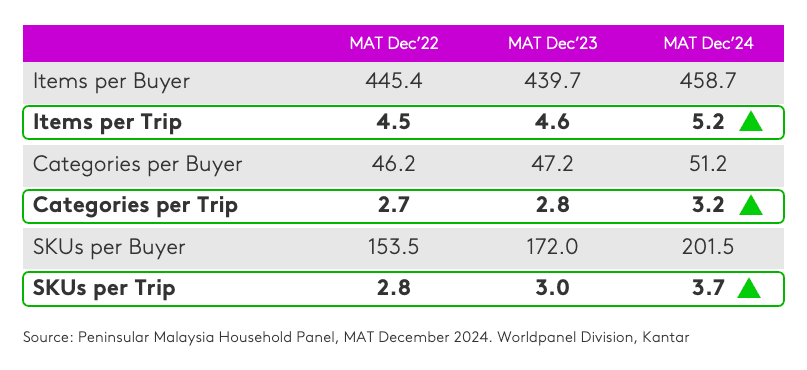
In the latest year, a typical shopping trip consists of approximately five items, spanning three categories, and four SKUs. This suggests that within a single trip, some SKUs are being purchased in larger quantities, as the number of SKUs per trip is lower than the number of items. Regardless of the metric used, volume growth is evident across all dimensions. Compared to last year, shoppers are now buying from four additional categories, scanning 19 more items, and incorporating 29 more SKUs into their overall purchases. However, an important observation is that SKUs are expanding at a faster rate than items, which indicates that although baskets are becoming more diverse, shoppers are purchasing smaller quantities of individual SKUs in order to accommodate a wider range of products.
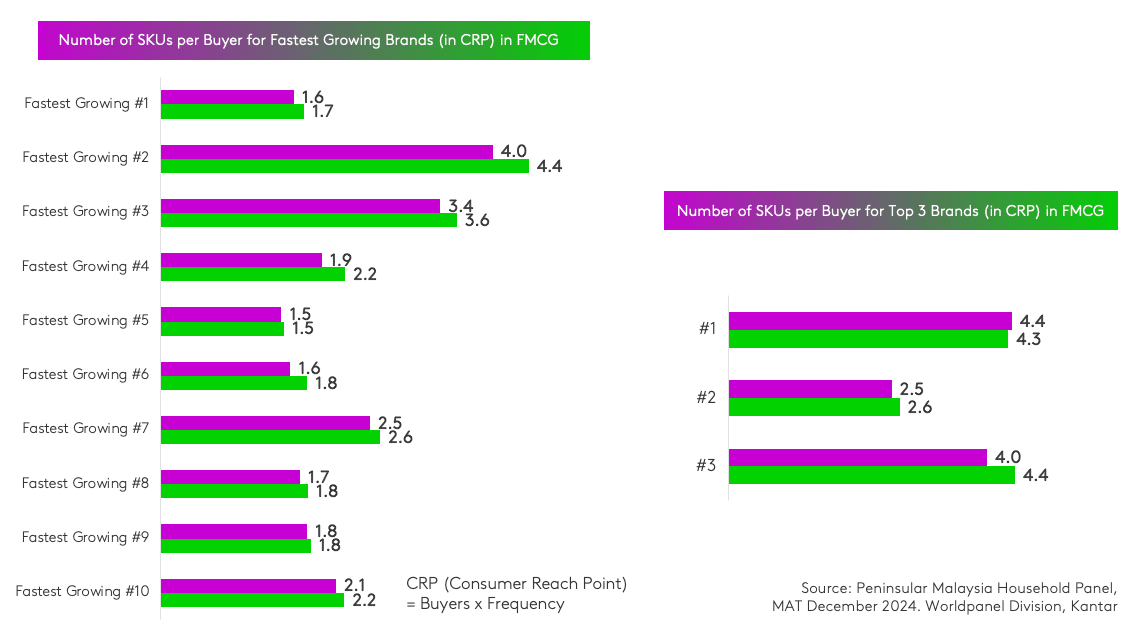
For brands, this evolving behaviour suggests that relying solely on well-established SKUs may not be a sustainable strategy in the long term. Innovation is critical to meeting the changing needs of shoppers. However, while SKU loyalty is declining, this does not imply that brand loyalty is diminishing. In fact, the fastest-growing brands in the market—as measured by Consumer Reach Points (CRPs)—have successfully encouraged shoppers to purchase a broader range of SKUs within their portfolio. The top three FMCG brands have experienced SKU per buyer growth that aligns with their CRP performance, demonstrating that successful brands are those that actively engage shoppers across multiple SKUs. None of the leading brands grew by sacrificing SKU per buyer; rather, they thrived by expanding their presence within their shoppers’ baskets.
With local brands leading in adaptability, multinational corporations (MNCs) must also find ways to adjust to this evolving landscape. A deeper understanding of shopping purposes will be key to maintaining relevance in an increasingly competitive market.